Radware®, a leading provider of application delivery and application security solutions for virtual and cloud data centers, announced the release of its latest quarterly study titled “State of the Union: Ecommerce Page Speed & Web Performance, Spring 2014.”
Chief among the research, Radware’s latest study reveals that, while 75 percent of the top 100 retail websites employ a content delivery network (CDN), the median home page takes a full second longer to become interactive than the median page that does not use a CDN.
CDNs help bring resources closer to users by caching static page resources in distributed servers across a region or worldwide. In theory, this Web performance solution reduces the amount of time it takes a host server to receive, process and deliver on a request for a page resource (images, CSS files, etc.).
Radware’s latest research shows that the median time to interact (TTI) for CDN-enabled sites was 5.7 seconds compared to the median TTI of 4.7 for non-CDN websites.
“This finding should not be interpreted as a criticism of content delivery networks,” says Kent Alstad, vice president of acceleration for Radware. “Instead, it should create awareness that CDNs address just one aspect of the performance problem. Web pages today are bigger and more complicated than ever, and CDNs can only partially mitigate this growth and complexity. Site owners need to be aware that there are performance issues caused by the pages themselves, and these performance issues require additional solutions.”
“While a one-second delay in interactivity does not seem significant, it can actually produce a significant negative impact on key performance indicators,” continues Alstad. “Our previous studies have shown that a one-second delay has increased bounce rates by 8.3 percent, decreased page views by 9.3 percent and even showed a 2.1 percent decrease in cart size, all of which can be detrimental to an eRetailer.”

Click through for findings from Radware’s latest quarterly study on e-commerce page speed and Web performance.
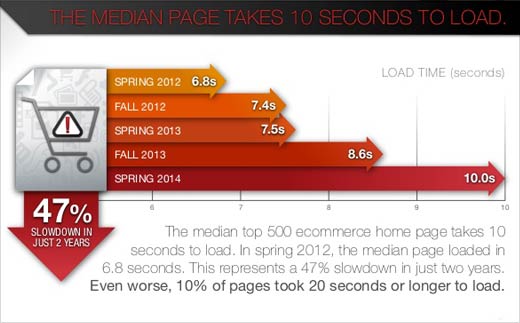
Median page takes 10 seconds to load.
The median for the top 500 e-commerce home pages takes 10 seconds to load. In spring 2012, the median page loaded in 6.8 seconds. This represents a 47 percent slowdown in just two years. Even worse, 10 percent of pages took 20 seconds or longer to load.
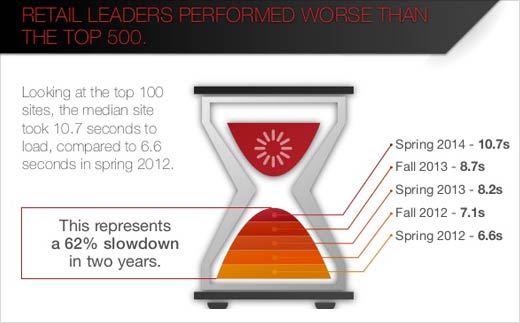
Retail leaders performed worse than the top 500.
Looking at the top 100 sites, the median site took 10.7 seconds to load, compared to 6.6 seconds in spring 2012. This represents a 62 percent slowdown in two years.
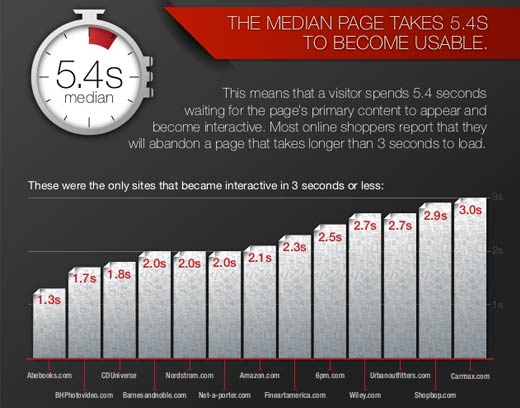
The median page takes 5.4 seconds to become usable.
This means that a visitor spends 5.4 seconds waiting for a page’s primary content to appear and become interactive. Most online shoppers report that they will abandon a page that takes longer than three seconds to load.
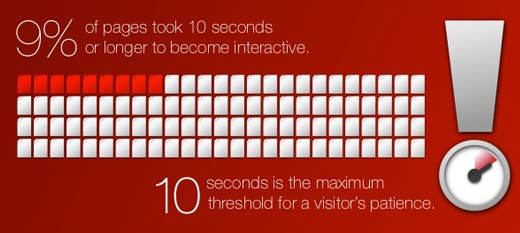
Nine percent of pages took 10 seconds or longer to become interactive. Ten seconds is the maximum threshold for a visitor’s patience.
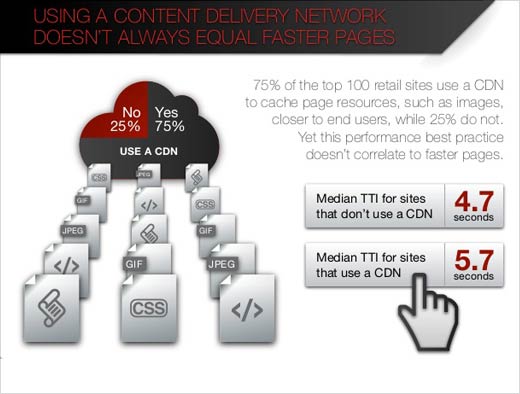
Using a content delivery network doesn’t always equal faster pages.
Seventy-five percent of the top 100 retail sites use a content delivery network (CDN) to cache page resources, such as images, closer to end users, while 25 percent do not. Yet this performance best practice doesn’t correlate to faster pages. The median time to interaction for sites that do not use a CDN was 4.7 seconds, for sites using a CDN, 5.7 seconds.
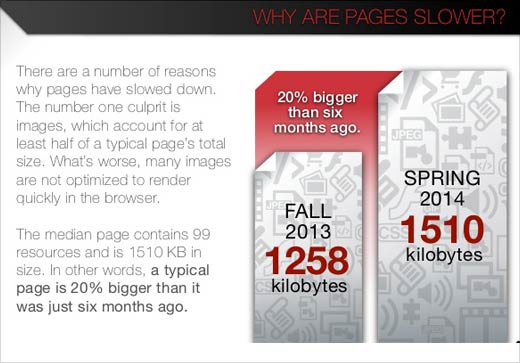
Why are pages slower?
There are a number of reasons why pages have slowed down. The number one culprit is images, which account for at least half of a typical page’s total size. What’s worse, many images are not optimized to render quickly in the browser. The median page contains 99 resources and is 1510 KB in size. In other words, a typical page is 20 percent bigger than it was just six months ago.
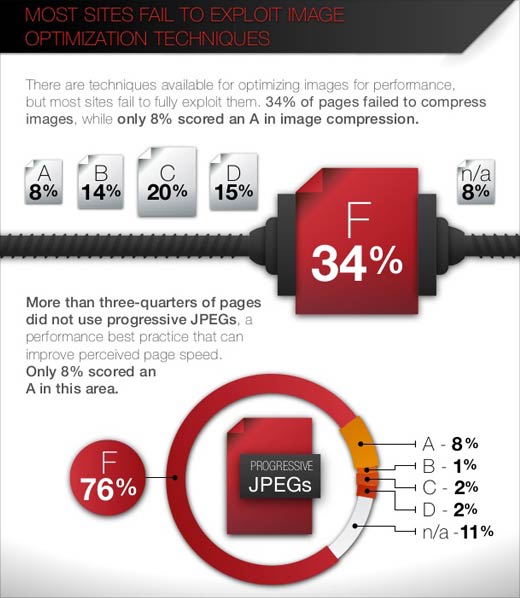
Most sites fail to exploit image optimization techniques.
There are techniques available for optimizing images for performance, but most sites fail to fully exploit them. Thirty-four percent of pages failed to compress images, while only 8 percent scored an ‘A’ in image compression.
More than three-quarters of pages did not use progressive JPEGs, a performance best practice that can improve perceived page speed. Only 8 percent received an ‘A’ in this area.