

Six Big Business Intelligence Mistakes
![]()
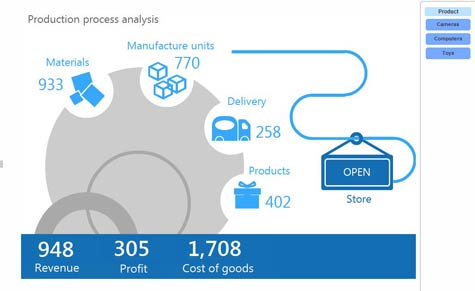
When it comes to business intelligence (BI) applications, infographics are quietly becoming the next big thing in visualization. Infographics have been around for awhile, but what is changing is how BI applications can now be used to create an infographic that is continuously upgraded.
The latest example of this capability comes from Panorama Software in the form of the release today of Panorama Necto 14, a BI application that includes data discovery tools that help more easily visualize complex data patterns.
Panorama Software CTO Rony Ross says one of the things that distinguishes Necto 14 is that it comes with visualization tools baked into the application. Rather than requiring organizations to acquire separate visualization tools, Necto 14 allows users to share infographics that can be continuously updated using live data.
The infographics themselves can be generated from a library of images that are included with Necto. Ross says the basic idea is that end users want access to tools that make it simpler to identify patterns and trends. As a Web-based application, Ross says Necto 14 makes it a lot easier to share those infographics than a user can via a BI application running on premise.
In addition to the infographics, Panorama Software is adding support for an ODBC connection wizard to simplify integration, tools that make it easier to organize slices of data, and a notification capability through which alerts concerning updates to a particular data set can be automatically shared.
Given the amount of influence that end users exercise over the BI application used within most organizations, the quality of the data manipulation experience is often the deciding factor among such apps. Most IT organizations would likely choose an app that can visualize the data that already exists inside the BI application over one that requires the use of a separate application to perform the same task.