Observability tools and platforms exist at the center of a distributed application architecture. They help DevOps and site reliability engineering (SRE) teams actively debug their systems rather than passively waiting for a customer, employee, or partner to report an outage. In the long run, successful observability helps reduce downtime and aids with continuous integration and continuous delivery/deployment (CI/CD), thus improving customer experience overall.
Observability tools measure system outputs to help IT teams understand what’s happening internally at any given time. To accomplish this, these platforms aggregate three types of system-wide telemetry data:
Metrics, which are performance-related KPI measurements such as memory usage and transactions per second
Logs,which are unstructured, qualitative records of events taking place within a system
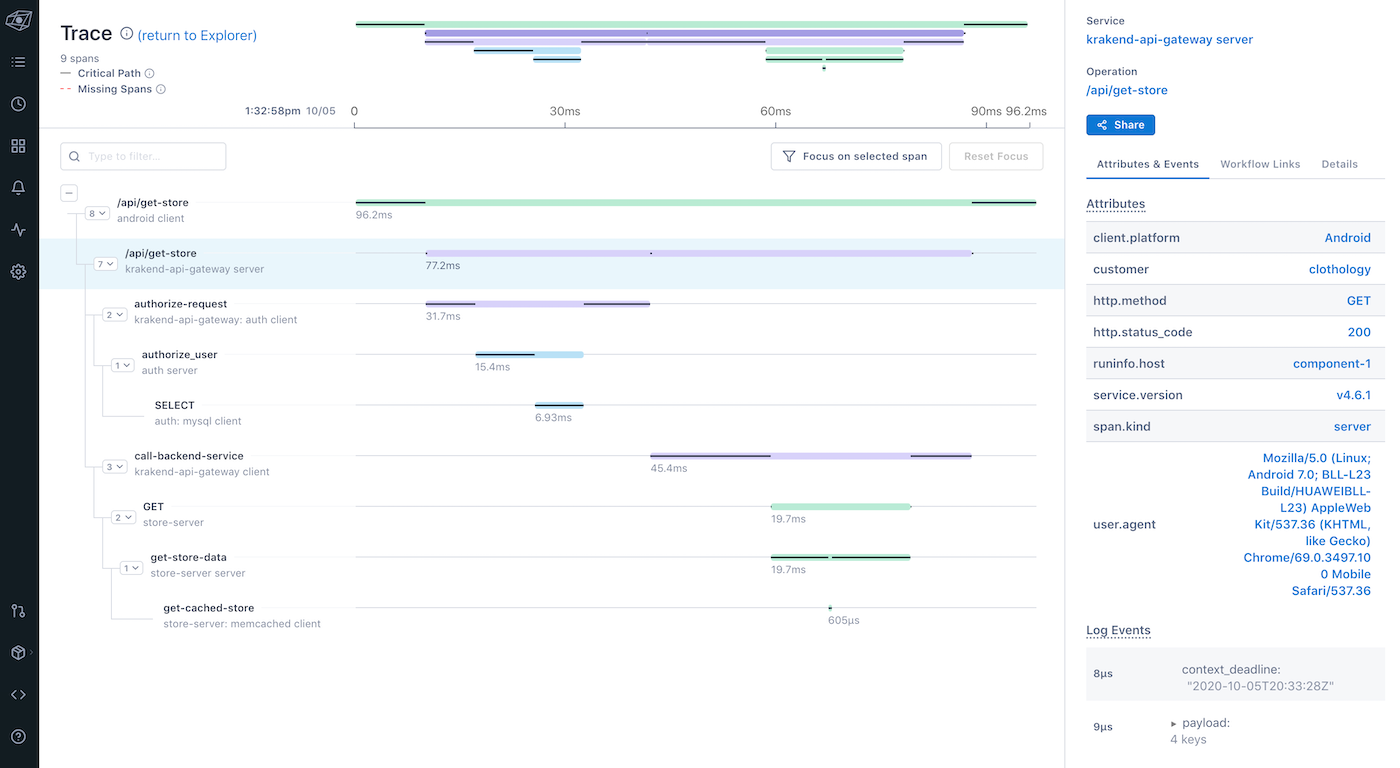
Traces, which connect the dots between sequential events
However, observability is greater than the sum of its parts. You must be able to view all of the information in one place for it to have any significant meaning. That’s where an observability platform provides value. With an observability platform in place, you can identify what the issue is, where it’s happening, and which systems are impacted. It can also tell you what caused the issue in the first place and what you can do to fix it.
Observability and monitoring are closely related, but they are distinct concepts. Monitoring tools like application performance monitoring (APM) software have historically been used to record information about events as they happen. For example, they alert DevOps and SRE teams if an application is down or if any problems need to be resolved. However, they fall short of providing a holistic view of an enterprise’s distributed application environment.
This is where observability solutions come into play. Observability platforms take the information gathered from monitoring tools and help identify patterns that would be otherwise obscured. Observability also makes it easier to pinpoint the root cause of a system-wide problem, whereas monitoring only provides the basis for a trial-and-error strategy. In many ways, monitoring tools are like a patient’s pulse oximeter, and observability platforms are like the patient’s team of doctors that use the blood oxygen information to diagnose broader health issues.
In summary, monitoring answers questions about what’s happening at any given time; observability takes this one step further to identify the why. In the context of this relationship, better monitoring leads to better observability, and unreliable monitoring makes observability impossible.
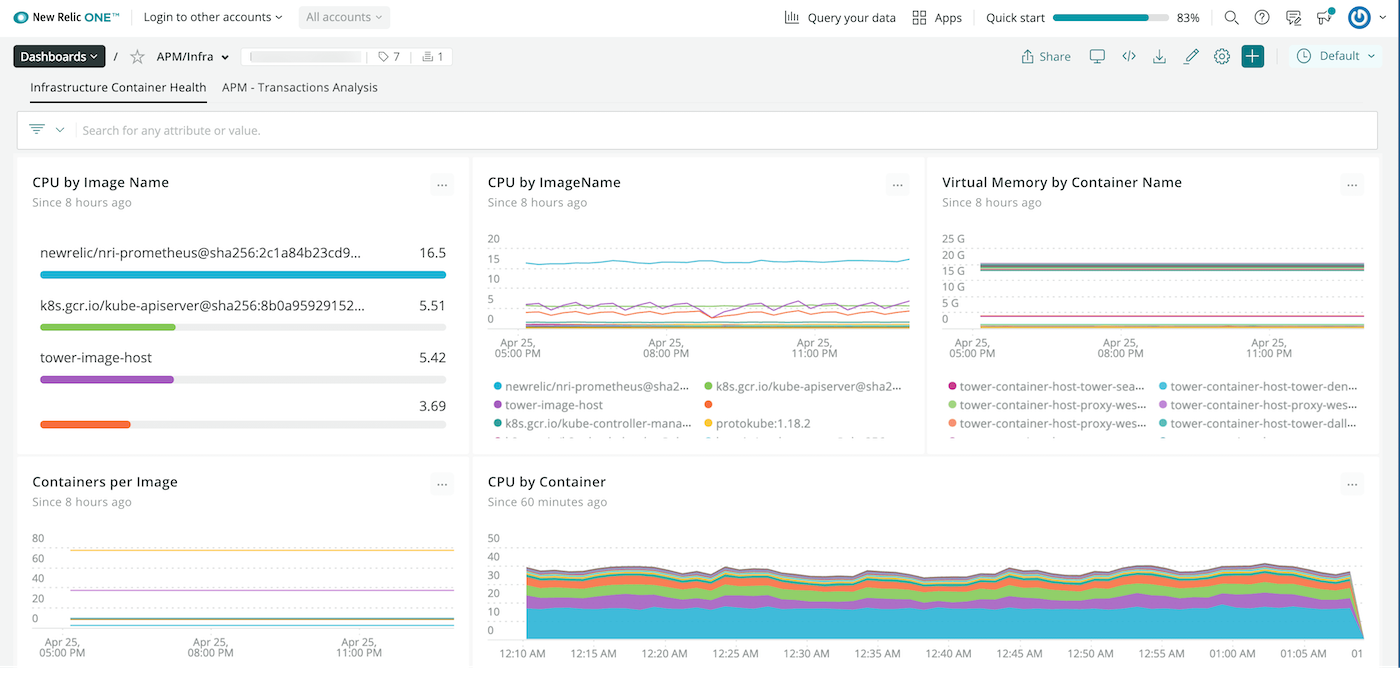
New Relic is a veteran in the observability market, and it’s stayed on pace with evolving tech trends and enterprise needs. The platform offers straightforward instrumentation and easily customizable dashboards. Plus, you can choose from more than 400 “quickstarts” that provide one-click integrations, dashboards, and alerts with the top software tools you use day-to-day.
Several users have commented that New Relic’s interface has a very clean and modern design that presents information in a visually appealing way. However, a nice GUI isn’t always intuitive or easy to navigate. In fact, some users have mentioned that clicking into different areas of the platform may lead to calls and emails from the sales team if the particular feature requires an upgrade.
Source: New Relic
Pros
Easy to use for tech teams
Real-time reporting
Fast query processing
Cons
Less-than-desirable navigation
Lack of streamlined documentation and tutorials
Confusing pricing structure
Pricing
New Relic offers four pricing plans. All plans include unlimited basic users, 100 GB of data, and one free full platform user.
Free: $0, with limited data and users
Standard:
$0.25/GB beyond included 100 GB
$99/full platform user (1 included for free, maximum 5 total)
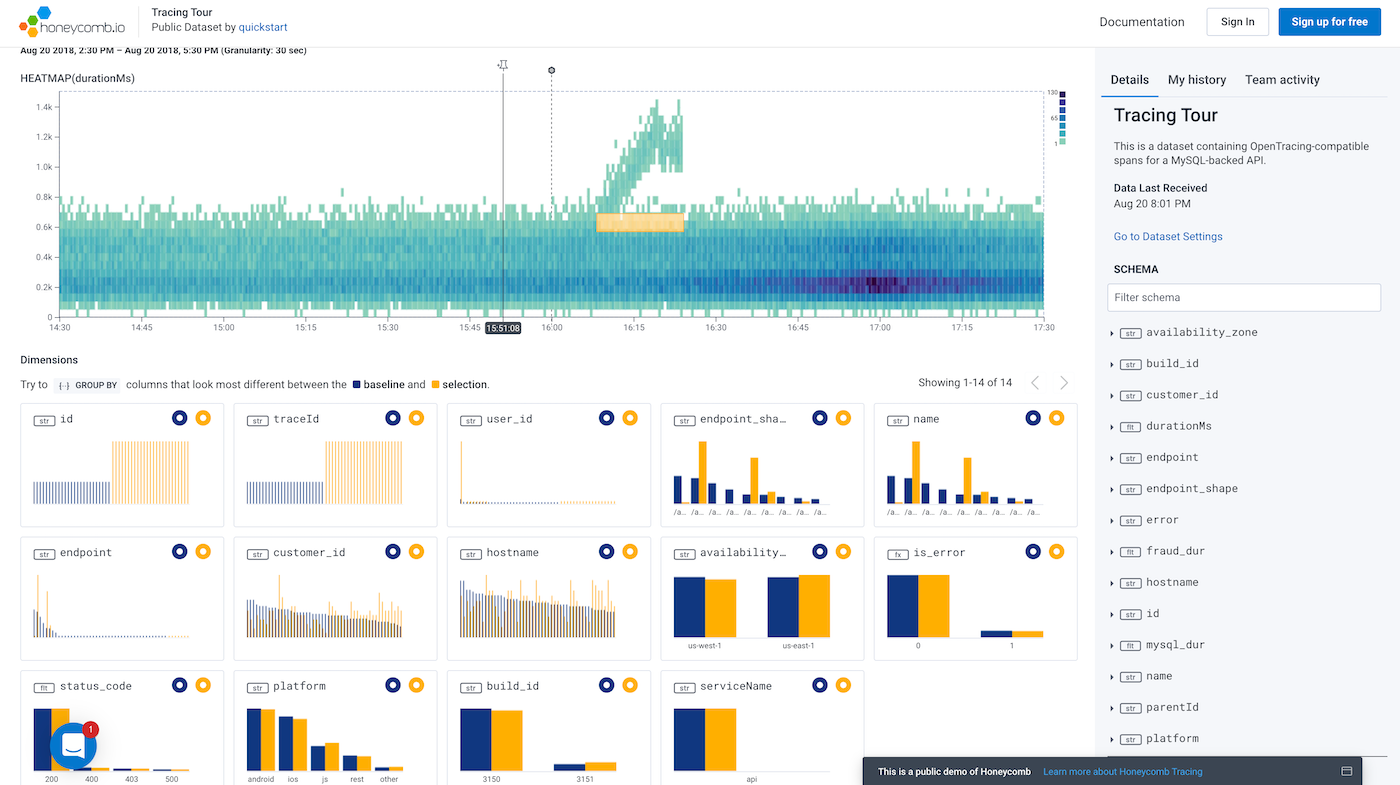
Honeycomb was built with an observability-first approach, which means it’s supremely positioned to help Dev, DevOps, and SRE teams operate more efficiently. No matter how complex your system is, Honeycomb provides a single view of all business events. One of the most impactful features is BubbleUp, Honeycomb’s tool that points you toward the correct dimension of an outlier event that’s causing issues.
Some users have noted that the Honeycomb interface can be a bit clunky or overwhelming when you’re starting out, but the platform offers extensive step-by-step tutorials to get up and running. On a similar note, a few users have commented that Honeycomb’s approach to observability lacks some of the traditional monitoring capabilities like live reporting and long-term data retention. Depending on your needs, this may be a drawback or a non-issue.
Source: Honeycomb
Pros
Automatic outlier detection
Guided tutorials
Query history
Cons
Lacks traditional monitoring capabilities
Clunky UI
Fewer integrations than competitors
Pricing
Honeycomb’s pricing is more straightforward than most observability platforms on the market. There are three pricing plans you can choose from:
Free: $0, with limited support, event volume, and triggers
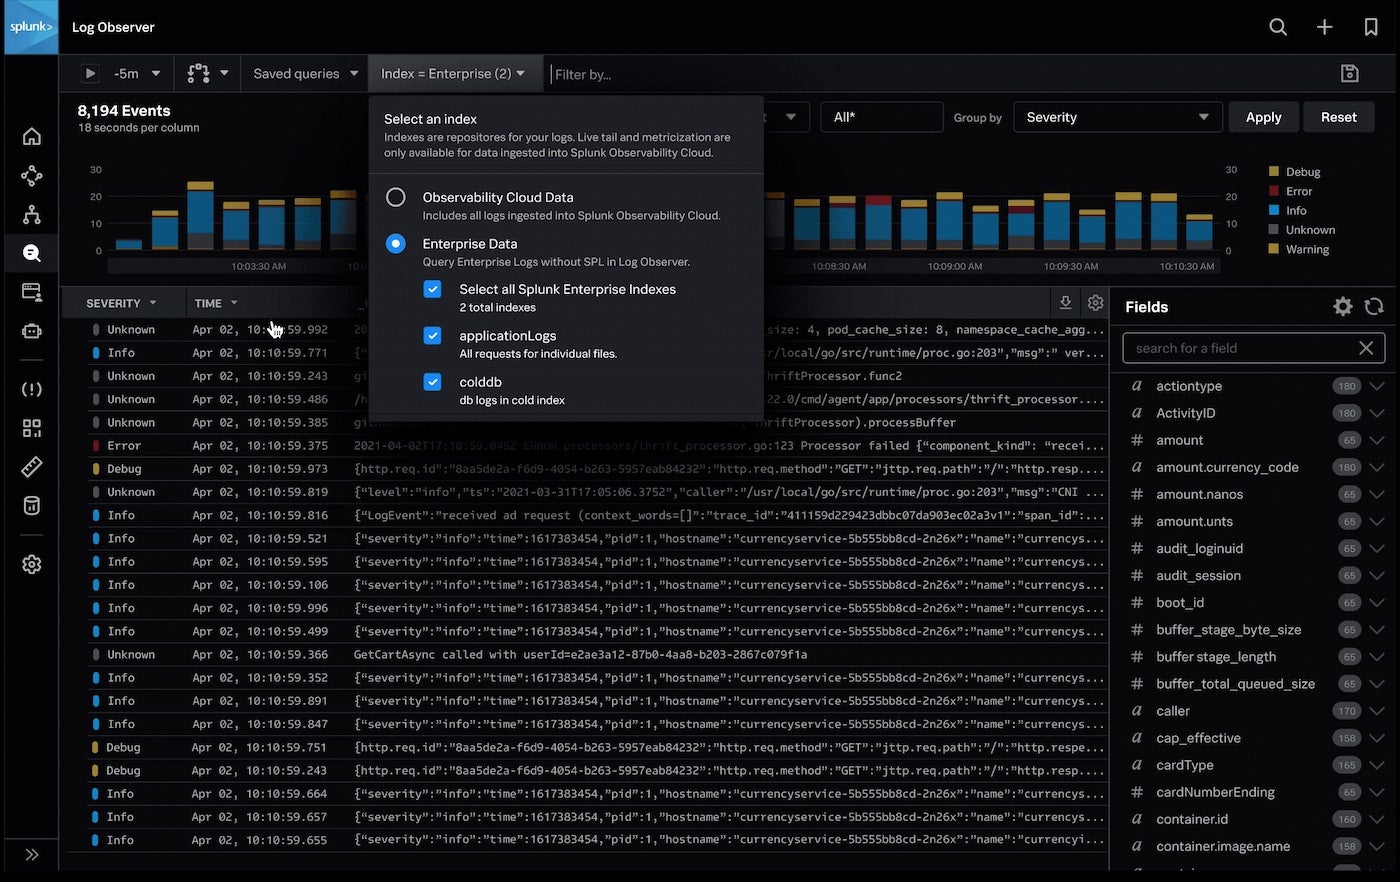
Splunk has been a giant in the APM market for nearly two decades, and it currently offers a smorgasbord of observability apps. There are individual solutions for infrastructure monitoring, APM, logging, front-end user monitoring, synthetic monitoring, and automated incident response. You can choose to add each of these apps à la carte, or you can bundle them for one monthly fee under the Splunk Observability Cloud.
One of the biggest benefits of Splunk is that its instrumentation features natively support OpenTelemetry, an open-source observability framework. This advantage means the whole platform is completely vendor-agnostic and provides a consistent structure for collecting telemetry data across applications. With this simplicity in your backend, you and your teams can spend more time improving app features and performance.
Source: Splunk
Pros
OpenTelemetry-native
Scalable
Full-stack support
Cons
Steep learning curve
Observability is an afterthought
Interface could use refinement
Pricing
There are many different ways you can slice and dice the Splunk Observability Cloud platform, but the top packages come down to full-stack observability or end-to-end observability:
Standard (full-stack observability): starts at $95/host/month
Plus (end-to-end observability): starts at $110/host/month
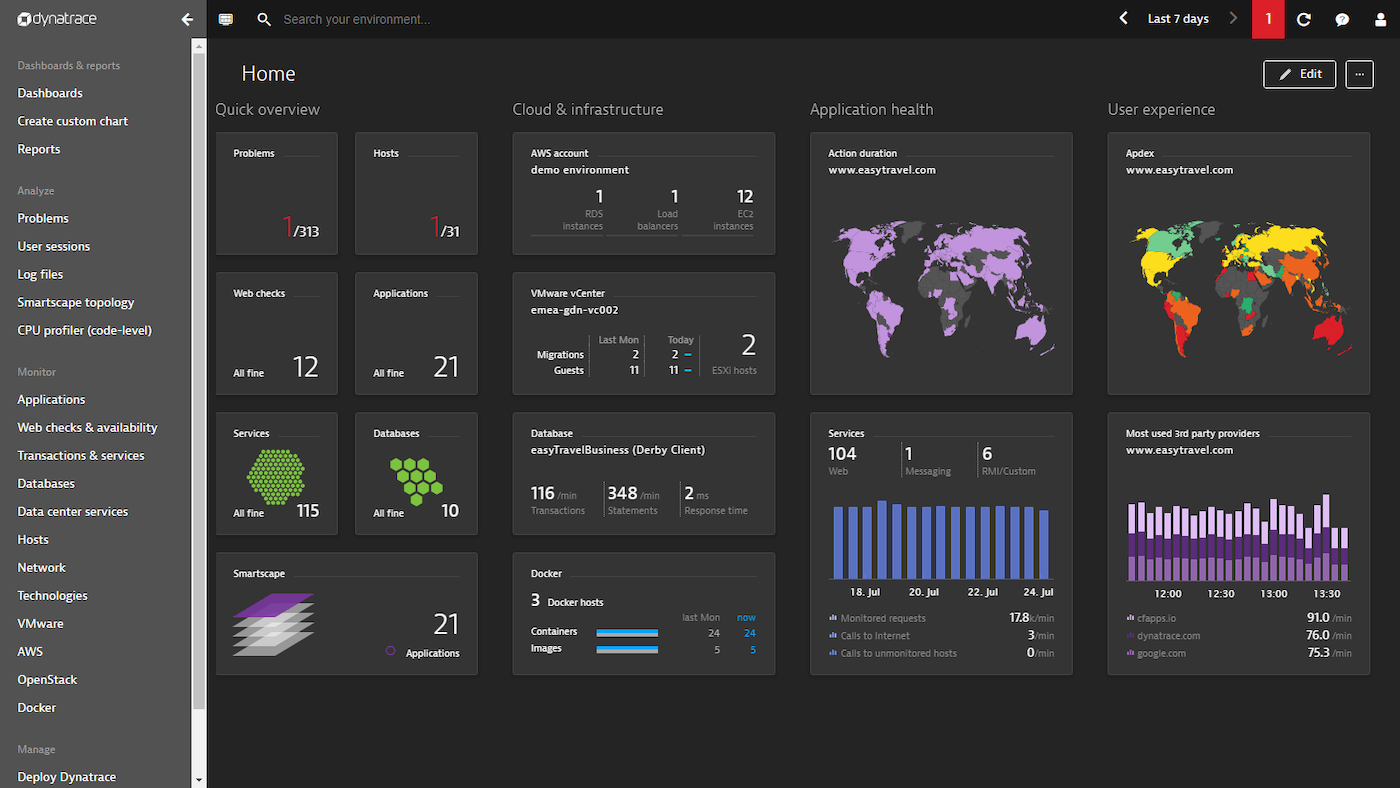
Similar to Splunk, Dynatrace is an all-in-one platform for full-stack observability, application monitoring and security, digital experience, business analytics, and cloud automation. However, what makes Dynatrace unique is its AI engine, Davis. Davis provides precise, automated insights about your system data instantly and continuously. These insights include dependency detection, anomaly detection, root cause analysis, and business impact analysis.
One drawback of the platform, however, is that Dynatrace’s pricing structure means it can get pretty expensive to implement. Several users have noted how high the total cost of ownership can get, especially if you want a truly all-in-one solution. The AI capabilities are unique, though, so it may be worth the extra cost in the long run.
Source: Dynatrace
Pros
AI-driven analytics
Easy to implement
Accessible customer support
Cons
Total monthly cost can get pricey
Complex implementation
Needs better documentation
Pricing
Dynatrace’s pricing is modular-based:
Full-stack monitoring: Starting at $69/month
Infrastructure monitoring: Starting at $21/month
Digital experience monitoring: Starting at $11/month
Application security: Starting at $12/month
Open ingestion: Starting at $25/month
Cloud automation: Starting at $0.12/Cloud Automation Unit
Lightstep is a relatively new player in the observability market, but its features are competitive with many of the market leaders. It uses the same OpenTelemetry framework as Splunk, plus a unique change intelligence tool that correlates events and anomalies then provides context for all alerts. Many users have also praised Lightstep for its ease of use and clean, intuitive design.
Because Lightstep is newer, though, many of the features are still maturing. The search functionality leaves much to be desired at times, and some users have reported slow performance. However, the Lightstep team releases new updates frequently, so they’re constantly evaluating where they have room for improvement.
Source: New Relic
Pros
Uses dynamic sampling rather than traditional triggers
Open-source libraries
Intuitive user interface
Cons
Slow data processing
Many features still in development
Documentation for satellite deployment could be better
Pricing
Lightstep offers three pricing plans:
Community: Free
Teams: Starting at $100/month
Enterprise: Contact sales for volume discounts
Advertisement
How to Choose the Right Observability Tool
The perfect observability tool will offer the features you need, integrate with the tools you use to develop and manage your applications, and stay within your budget. More importantly, though, it will help your DevOps and SRE teams operate more efficiently. In turn, this helps improve customer experience and drive broader business goals.
After reviewing the observability tools on this list, you still might be unsure which solution is the best for your organization. The best way to narrow it down is to read testimonials from customers like you, so you can get a better understanding of how each platform will meet your needs. Then, explore the free editions of your top picks or consider starting a free trial to test drive them for yourself before committing to one.
Kaiti Norton is a Nashville-based Content Writer for TechnologyAdvice, a full-service B2B media company. She is passionate about helping brands build genuine connections with their customers through relatable, research-based content. When she's not writing about technology, she's sharing her musings about fashion, cats, books, and skincare on her blog.
The go-to resource for IT professionals from all corners of the tech world looking for cutting edge technology solutions that solve their unique business challenges. We aim to help these professionals grow their knowledge base and authority in their field with the top news and trends in the technology space.
Advertiser Disclosure: Some of the products that appear on
this site are from companies from which TechnologyAdvice
receives compensation. This compensation may impact how and
where products appear on this site including, for example,
the order in which they appear. TechnologyAdvice does not
include all companies or all types of products available in
the marketplace.