
An IT organization of any size spends a lot of time looking at myriad dashboards tied to specific products and services in the hope that some larger truth will eventually make itself apparent.
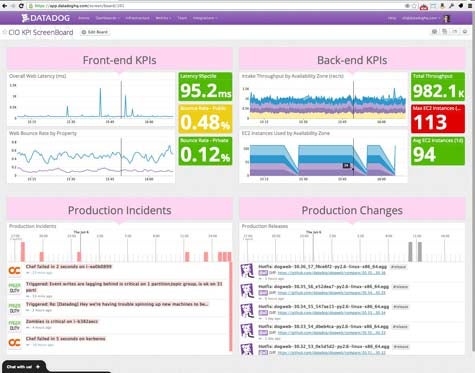
Of course, that rarely happens, which is why Datadog, a provider of a software-as-a-service (SaaS) application for monitoring and analyzing IT infrastructure resources, has released Screenboards to unify the key performance indicators for IT organizations under a single set of dashboards.
According to Datadog CEO Olivier Pomel, the problem most organizations experience is that when it comes to managing IT, every new product added comes with a new set of tools for managing it. That creates not only a challenge in terms of all the people needed to manage all those different technologies, it requires IT organizations to dedicate IT infrastructure to run each of those tools.
Screenboards reduces the need for all those different tools by allowing IT organizations to track key performance indicators across multiple classes of products. That’s key, says Pomel, because rather than standing around blaming each other when there is a problem, IT organizations can more easily see the relationship between different products in terms of how, for example, changes in configurations are affecting the performance of a specific application service.
Pomel says the Datadog dashboards can be published as a URL that any stakeholder in the organization can access, and include support for real-time updates and a rich set of widgets for generating performance graphs.
As part of the trend toward unifying DevOps, Pomel says Datadog Screenboards create a simple way for IT organizations to get a better handle on what’s happening with their own and third-party data centers running in the cloud. After all, once everybody can agree on what the problem is, solving it usually takes a few minutes. Unfortunately, it can take days, weeks and even sometimes months before everybody can come to terms regarding what the problem really is.