Knowing how much budget and what resources to allocate to cybersecurity is no easy task. How much security is needed? Where can the expenditure be most effective? Where is my best ROI? While this has traditionally been left to security professionals to make the business case, ownership of cybersecurity efforts and risk mitigation is starting to shift to the C-suite as recent high-profile breaches have shown a major impact on customer satisfaction and loyalty, stock price, jobs, and an organization’s bottom line finances.
Making the right investments can minimize the cyber risks your organization faces, but this requires looking at the complete picture and not just a few pieces. Often, a key missing piece of the puzzle is an understanding of what cyber events are occurring in your industry. Who’s getting hit by whom? What methods are being used to carry out an attack? What’s being targeted? What’s the impact? And what should you do to limit the cyber risk to your organization?
Armed with this information, you can look at the cyber problems trending in your space and allocate resources accordingly, ultimately giving you a competitive advantage. Take the IT industry, for example. In this slideshow, Jason Polancich, founder, chief architect, SurfWatch Labs, looks at the risks prevalent in Q3 and how a typical budget stacks up.
Q3 IT Cybersecurity Review
Click through for a review of the IT cybersecurity landscape for Q3 2014, provided by Jason Polancich, founder, chief architect, SurfWatch Labs.
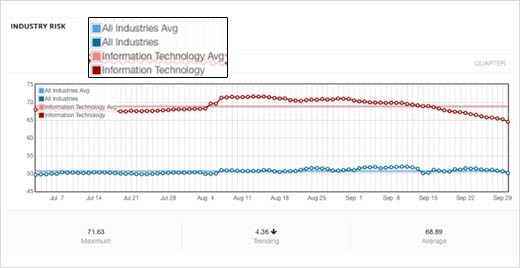
Industry Risk
In Q3, the overall industry risk score of 68.89 for IT was higher than the industry’s average in August and the first half of September, and significantly higher than risk scores for other industries, as indicated by the blue lines for “All Industries” measured by the SurfWatch Analytics API. (All industries include health care, financial services, consumer goods, government, entertainment and industrials.) The 4.36 downward trend indicates the measurement taken on the final day of the quarter, Sept 30, as compared to all of Q3, thereby reflecting the downward trend as compared to happenings in August and early September.
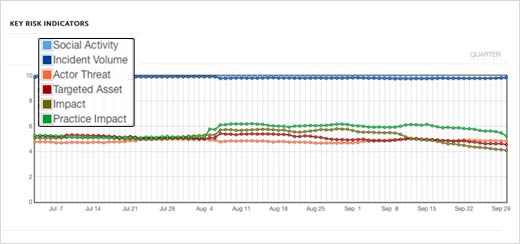
Key Risk Indicators
Key risk indicators give a general breakout of the severity of actors (who was responsible for the attack), targeted assets (what the attacker was going after), impact (what happened) and practice (how attackers conducted the attack) as well as a look at social activity and incident volume (blue lines above). For IT in Q3, there was a high volume of uniquely reported cyber events and a similar volume of social media discussion related to these events. Perhaps most interesting, and potentially damaging, was how cyber criminals propagated attacks. The green line indicates practice, or how the hackers conducted their attack, and for August and early September, it’s higher than normal. Let’s dig deeper into this…
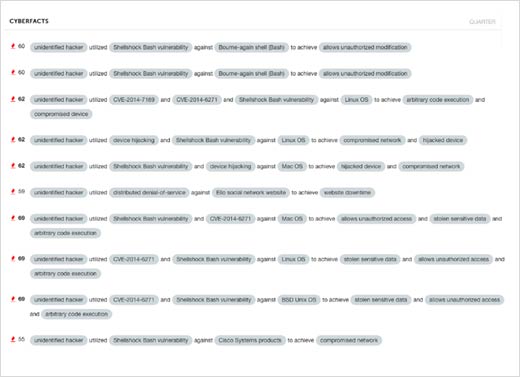
Cyber Facts
Drilling down into cyber event data that has been standardized by actor, target, effect and practice (ATEP), we see a common theme emerge for IT in the CyberFact ‘practice’ tags – Shellshock Bash, a widely exploited, damaging software vulnerability that is responsible for the above average cyber activity in the IT space. While Shellshock was a common theme, the impacts varied from allowing unauthorized modification to compromised network to code execution, hijacked and compromised devices, stolen sensitive data, etc.
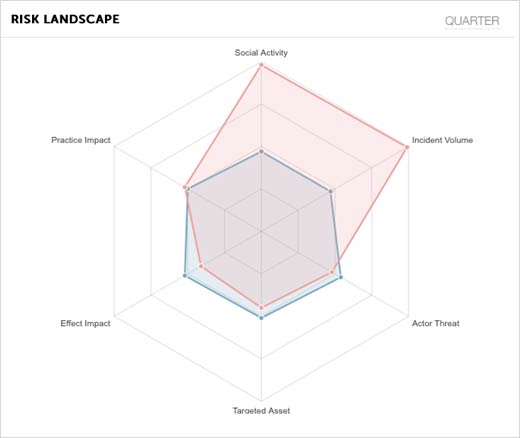
Risk Landscape
Another item identified in the key risk indicators for IT in Q3 was a very high level of social activity and incident volume in Q3. This is actually more typical than not, unfortunately. IT and the entertainment industry often see high attack volumes and subsequently, a lot of people talk about it. Microsoft, Apple, Twitter and others are favorite victims of the bad guys because of the attention they are often able to garner by going after such high-profile attacks. In August and early September, Shellshock widely impacted a large number of organizations and was the topic of many social conversations. If as an IT organization, Shellshock wasn’t on our radar, a quick look at these stats tells you it should be. Fast.

Current Budget Versus Trending Cyber Risks
How does an external view of current happenings in your industry help you shape your infosec budget? This has been a missing link in security discussions as organizations traditionally have added new tools to address niche problems, but without truly understanding if they’re spending money and resources in the right areas. By plugging a typical IT organization security budget into the API, we can see a disproportionate level of spend at the software vulnerability layer. With Shellshock taking center stage in August and early September, it’s immediately clear where strategic, personnel and financial priorities would need to shift to better secure your organization from that cyber risk.
These figures represent a look back at Q3, but you can also trend out across the year, for example, to better plan for the next year. Real-time understanding of the risks your industry is facing will help identify the types of security resources and tools you need. Said simply, know your risks and plan accordingly.