Data visualization has gone from being an esoteric concept to a mainstream element of the business intelligence experience in a few short years. But there’s always room for improvement.
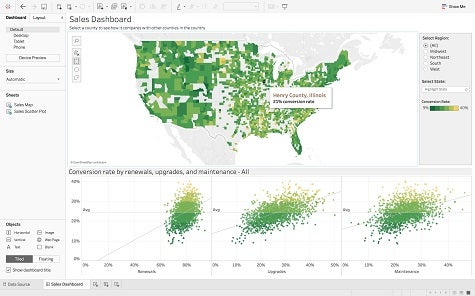
In the next few weeks, Tableau Software will make available Tableau 10, an update to its data visualization software that features a revamped user interface and dedicated support for Android phones.
Ashley Bass, senior manager for product management at Tableau Software, says the company is making a concerted effort to leverage the unique capabilities of the devices it supports in order to provide a user experience that natively takes advantage of the features and functions of that device. In the case of data visualization, Bass notes, users are reading reports on mobile computing devices.
As part of this release, Tableau is making it simple to join data and then publish data extracted from Oracle and Microsoft SQL Server databases. Also on tap are collaboration tools that make it simpler to share reports across a specific team of people or simply publish a particular visualization on the Web. Overall, Bass says, the data preparation and ability to interrogate data is now much more sophisticated within Tableau 10.
Of course, the most interesting thing about the rise of data visualization tools such as Tableau from an IT perspective is the increased business value these tools enable. For years, IT organizations have been creating static reports that not many people actually read. Now suddenly everybody wants to visualize that same data, which just goes to show that inside and out of IT, a picture is still worth a thousand words.


