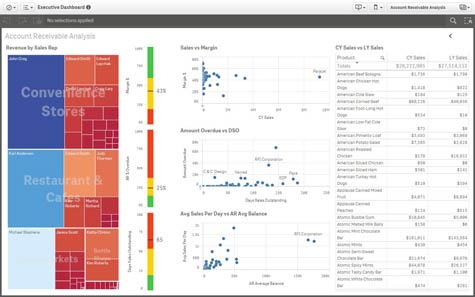
At the Qonnections 2015 Global Partner 2015 conference today, Qlik unveiled an update to its data visualization platform that adds self-service capabilities while at the same time providing simpler access to external data sources.
In addition, Qlik unveiled an implementation of the Qlik Analytics Platform aimed specifically at developers and announced the general availability of multiple services on Qlik Cloud, an implementation of the Qlik platform running on Amazon Web Services (AWS) that is designed to make it easier for end users to share data.
Josh Good, director of product marketing for Qlik, says Qlik Sense 2.0 extends the company’s core QIX Associative Indexing Engine technology in ways that make it simpler to visualize data and create reports, while still giving IT organizations the level of governance needed to meet regulatory requirements.
When it comes to creating content, organizations are still required to deploy Qlik Sense 2.0 on premise or in a hosted environment. Qlik Cloud is designed to make use of AWS to enable organizations to share public and private data, while also gaining access to over 100,000 data sets from 200 providers of data sources that Qlik is making available via a Qlik DataMarket that Qlik acquired last November.
Finally, the developer edition of the Qlik Analytics Platform exposes the in-memory columnar data store at the heart of the company’s platform via a set of open RESTful application programming interfaces (APIs) that can be invoked by a Qlik toolkit.
In time, Good says that Qlik will enable customers to create and publish data visualization wherever they see fit. For the time being, however, Qlik is taking advantage of AWS to provide access to an inexpensive medium for sharing large amounts of data, says Good.
Data visualization tools have been one of the hottest business intelligence (BI) segments thanks mainly to end users discovering the ability to more easily share insights and knowledge using graphics to narrate data that would otherwise lack any real context inside a spreadsheet or static reporting tool. With these latest offerings from Qlik, the spectrum of individuals inside the organization who can invoke data visualization software is now expanding beyond analysts to include everyone from professional developers to the average end user.


